Orsat
OrsatCloud based AutoGC data management tool
Merlin AutoGC Xplorer (MAX)
The analysis of volatile organic compounds in ambient air is now a requirement at many sites in the EPA NCore Network and the hourly measurement of as many as 58 target compounds poses a significant data management challenge to state agencies. MAX is a cloud-based data management tool designed specifically to meet the needs of agencies using automated chromatographic systems (AutoGCs) to measure VOCs in ambient air.


Explore & Review
Data can be viewed in different interactive forms such as bar graphs, line charts, and detailed lists that include sample status and component concentrations.

Validate
Quality control data is automatically identified and pass/fail criteria applied. Ambient data can be reviewed, qualified and flagged.

Report
QuickLook reports allow easy review of daily performance. Easy export of ambient or quality control data.
Key Features:
- Easy to use data loading via ASCII report files generated by the chromatography data system from hourly samples
- Re-submission after reprocessing of data on the chromatography data system
- Control charting for daily check sample
- Time series and scatter plots of VOCs across sites or across time
- Easy export of quality control data or ambient data
- Data completeness tracking
- Daily QuickLook reports
Explore Ambient Data and Review System Performance All in One Place
The Merlin AutoGC Xplorer or MAX is a cloud-based Data Management tool designed specifically to meet the needs of Agencies using automated chromatographic systems to measure hourly non-methane hydrocarbons (NMHCs) in ambient air. MAX is designed to work with the Orsat AutoGC Systems developed around either the PerkinElmer Ozone Precursor System using the Turbomatrix Thermal Desorber and TotalChrom Data system or the Markes Unity Thermal Desorber coupled with an Agilent System using the Open Lab EZChrom CDS. Both of these systems have been fully automated to provide excellent laboratory quality data in the field. The automatic introduction of daily quality control checks using the Merlin MicroScience Dilution System and custom sequences generated using Merlin EZSequence generator allows ASCII results to be loaded into MAX to provide rapid review of data on a daily basis.
Automatic Recovery Calculation
MAX automatically calculates recoveries for daily check samples and provides a daily QuickLook report showing results for all targets which helps operators monitor the system performance on a daily basis. All quality control data including daily checks, second source comparisons, retention time standards and blanks can be charted over extended periods for data validators to review system performance over time. Ambient data can be graphically reviewed to check for common issues related to possible misidentifications or errors in integration using time series plots of multiple targets or multiple sites. Retention times can be graphed as well to help identify periods where targets may have been misidentified. MAX shows the data file name for each data point allowing validators to retrieve the chromatographic data and review it directly facilitating the recovery of data lost by misidentification or poor integration. Managers and validators can use MAX to review network performance over weeks or years.
Bar Graphs of Sample Recoveries
From the Daily QuickLook samples can be viewed as a bar graph of target concentrations for either chromatographic column. Hourly samples can be quickly reviewed visually for missing targets or unusual target concentrations to help data reviewers to determine samples which may be invalid or reflect instrumentation failures.
QuickLook: Bar graph representation of results from one sample off one column
Review QC Data in Detailed Tables
Calibration verification samples (CVS) are scheduled daily by the Merlin EZSequence software and recoveries are shown in the QuickLook. A second-source, statically-diluted laboratory check sample (LCS) is run weekly and these recoveries are also automatically reported in the QuickLook. The MAX configuration allows the entry of target concentrations and dilution factors along with start and stop dates for standards currently in use at each site. Pass/Fail limits can be configured to allow quick identification of problems in the QuickLook reports.
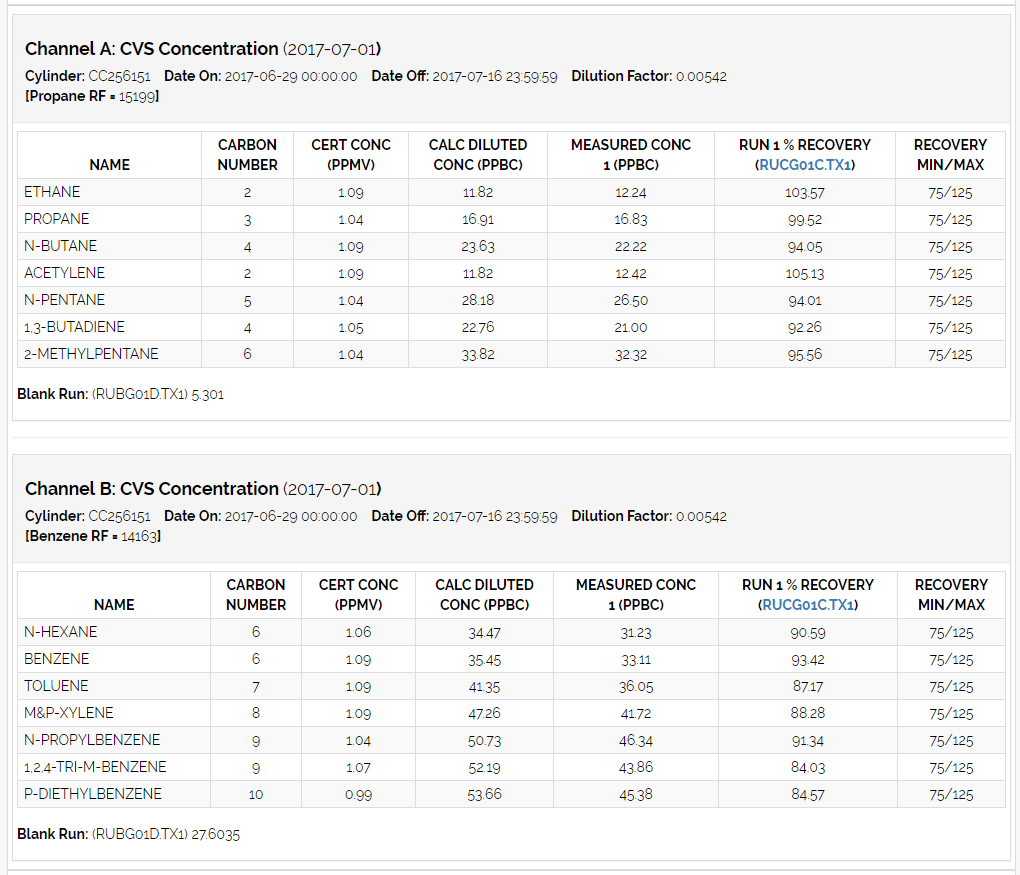
Data table of daily calibration verification sample (CVS) recoveries from a single day.
Visualize QC Data with Interactive Graphs
System performance via quality control data can be reviewed over days, months or even years in interactive graphs. CVS, LCS, and retention time standard (RTS) recoveries or amounts can be displayed in different graph formats as well as output in Excel or CSV files. Graphing allows operators to see system drift and implement system changes to reduce data losses from trap failures or other system deterioration. Interactive mouse-over effects show additional information such as specific ASCII input detail and exact recovery numbers.
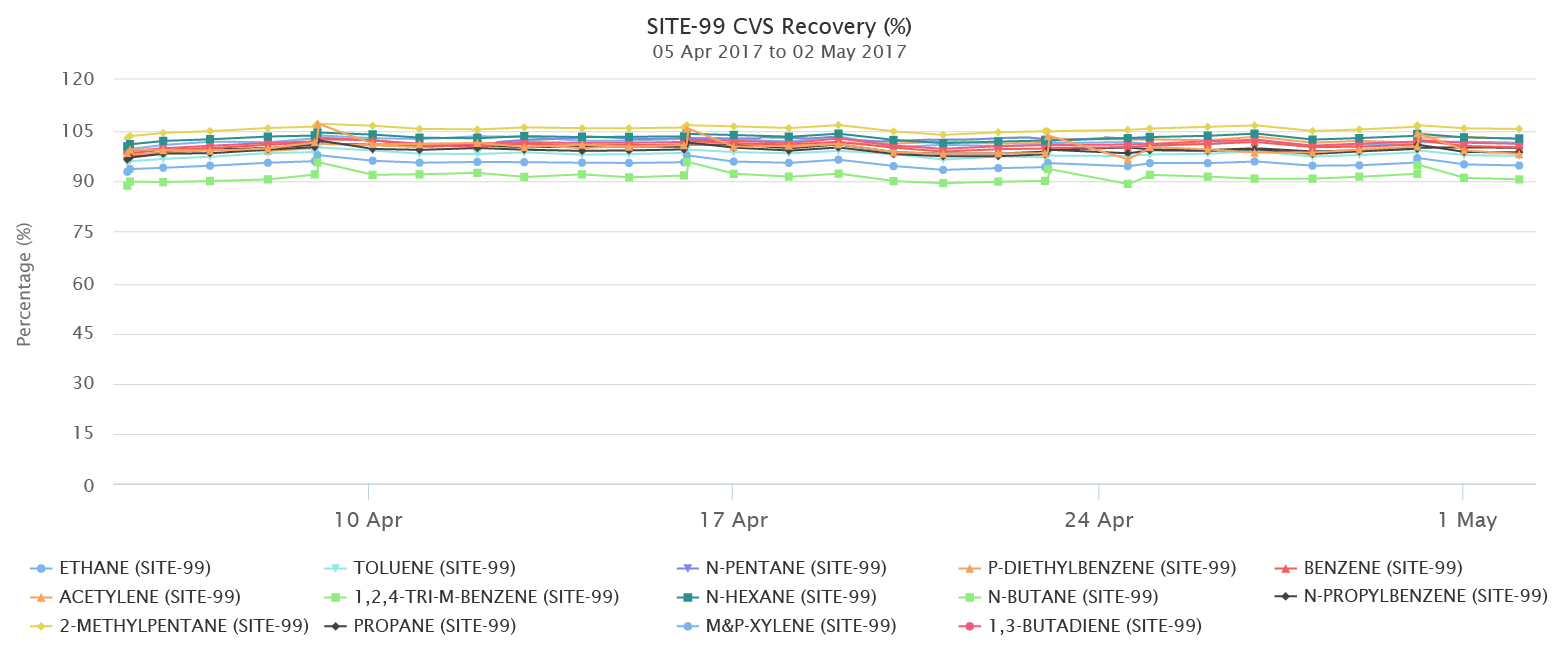
Graph of daily calibration verification sample (CVS) recoveries over two weeks.
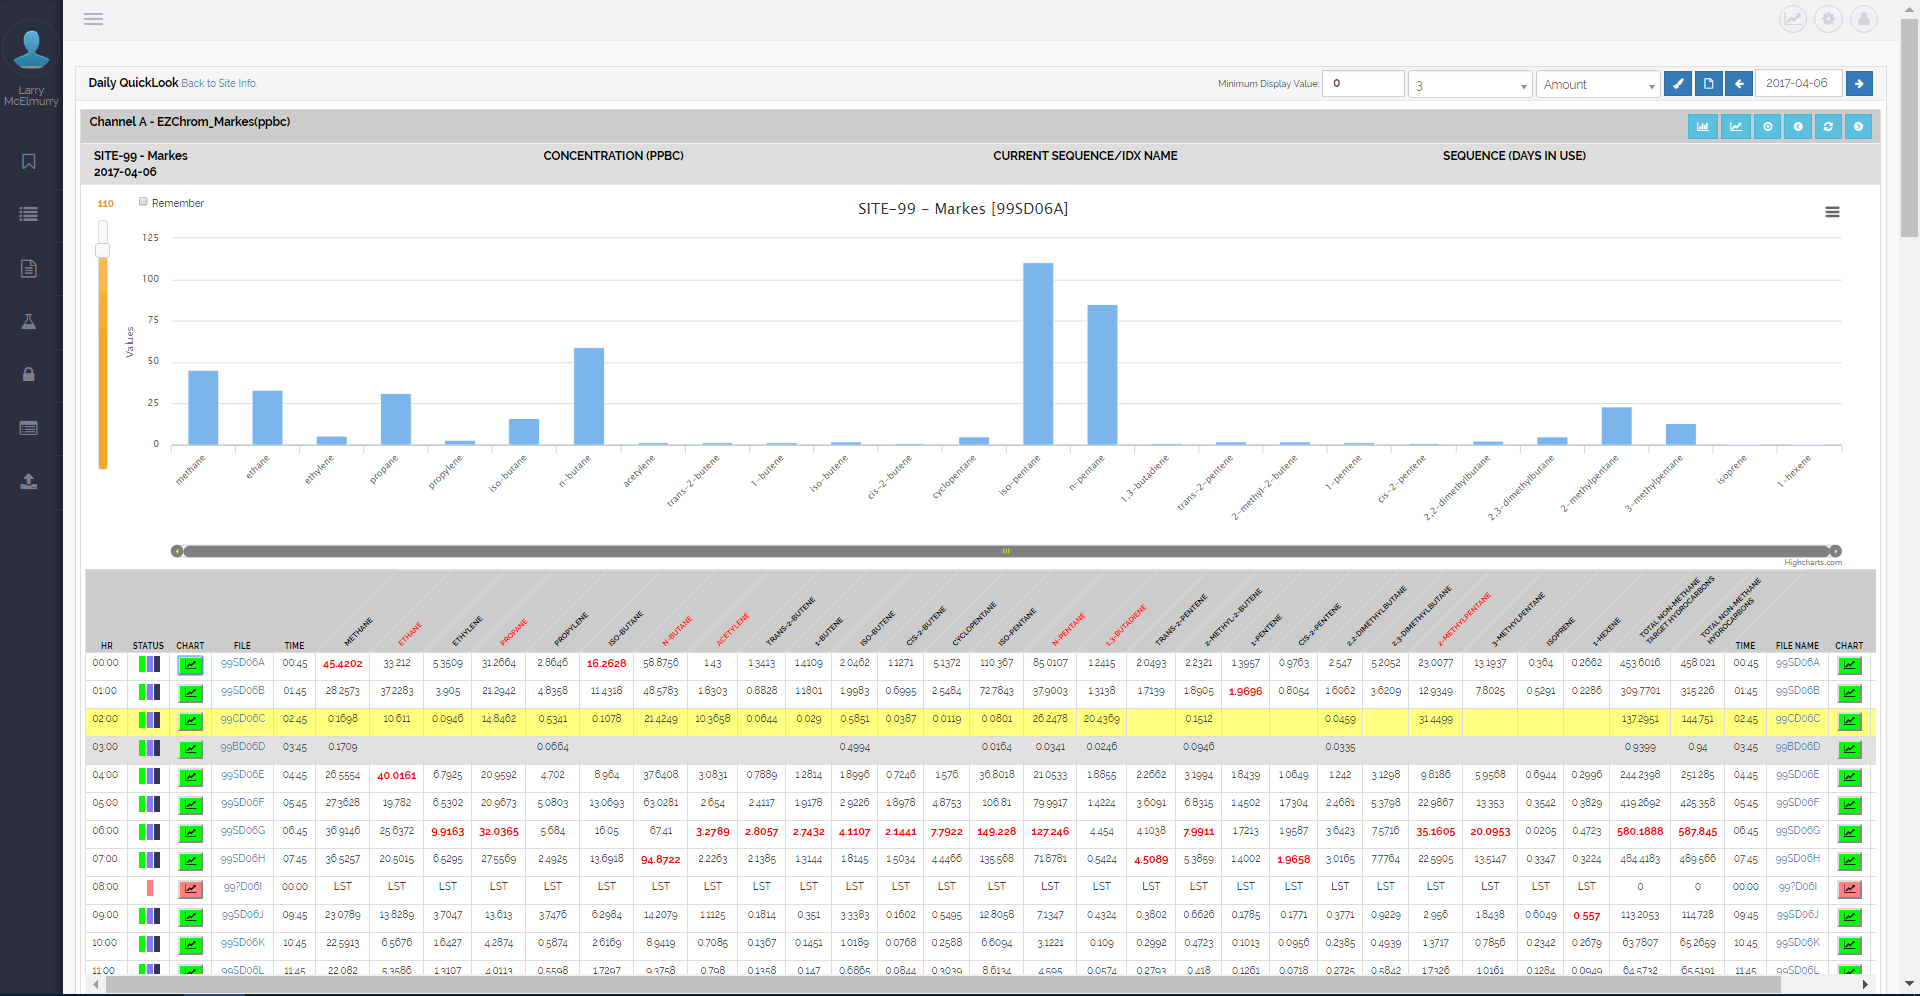
Daily QuickLook Table
The Daily QuickLook shows all the results for the day with quality control samples highlighted. This “day-at-a-glance” report allows review of hourly target concentration bar graphs as well as CVS or LCS recoveries, concentration of targets in blanks and retention time samples. From the QuickLook, the operator or validator can review system performance as well as the status of each hourly sample. Status flags show if data has been reprocessed, reloaded, or does not meet the sample interval criteria.
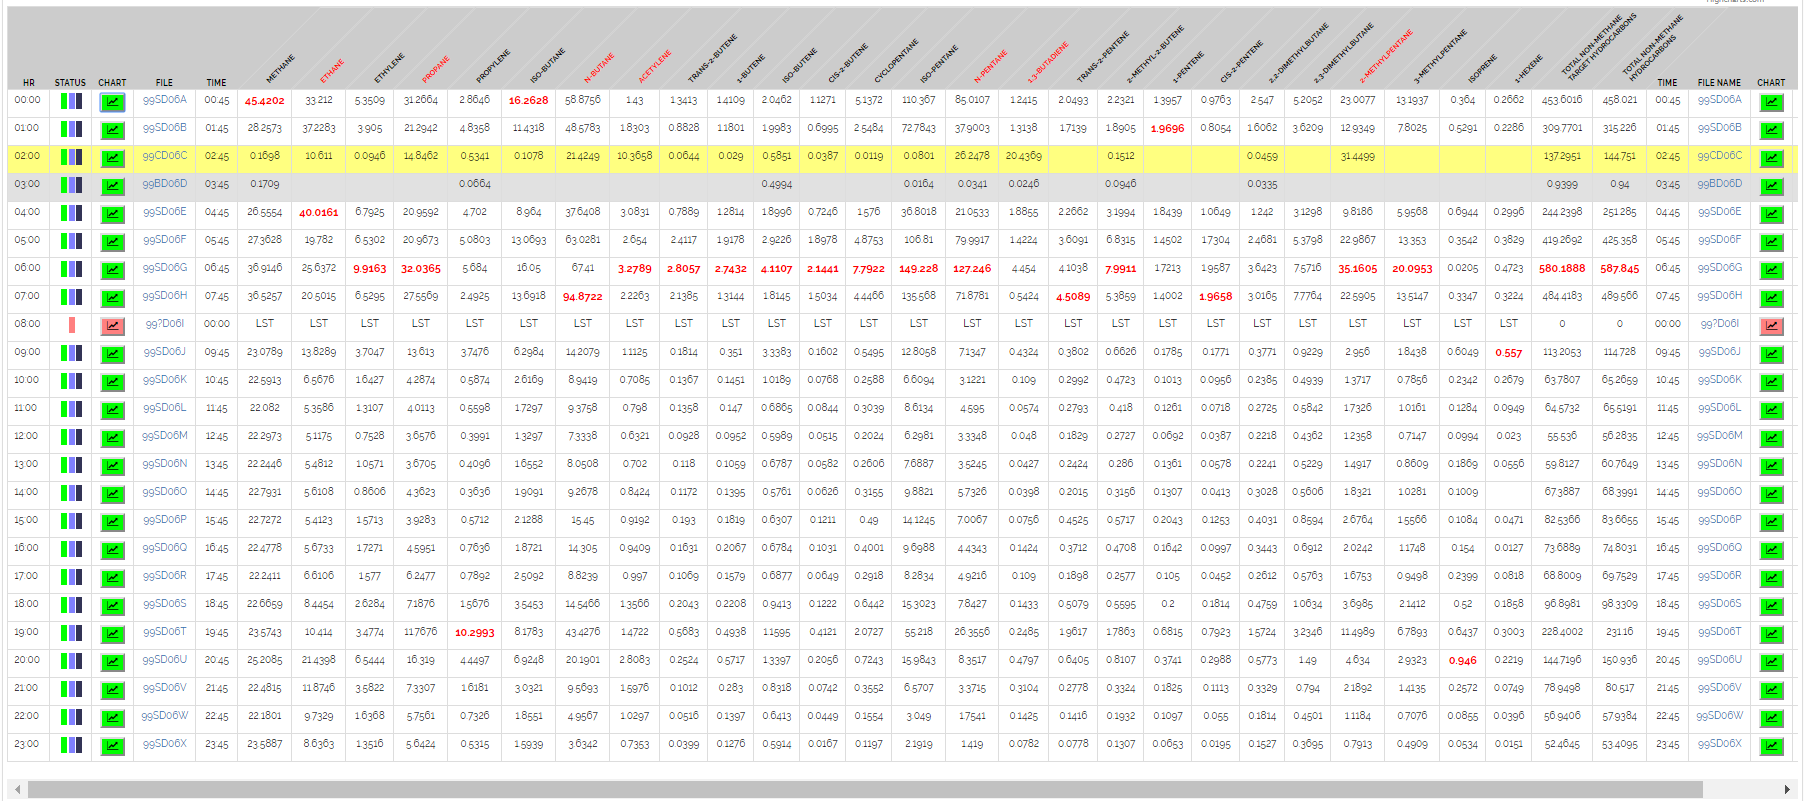
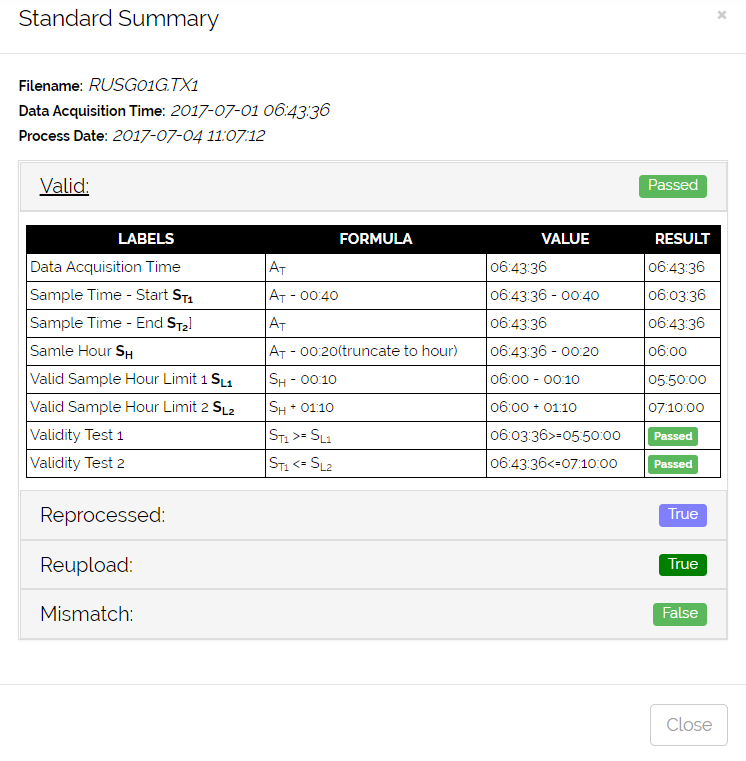
The QuickLook sample table (left) lists status of each sample and concentration values of each compound with additional sample details easily available (right).
Target concentrations in Daily Blank
In addition to the daily check sample, a blank is also run daily and the concentrations of all targets from this check is also shown in the QuickLook. Concentrations of targets from blank runs can be graphed along with totals. Operators can track the system contribution to their analytical results and determine problems quickly.
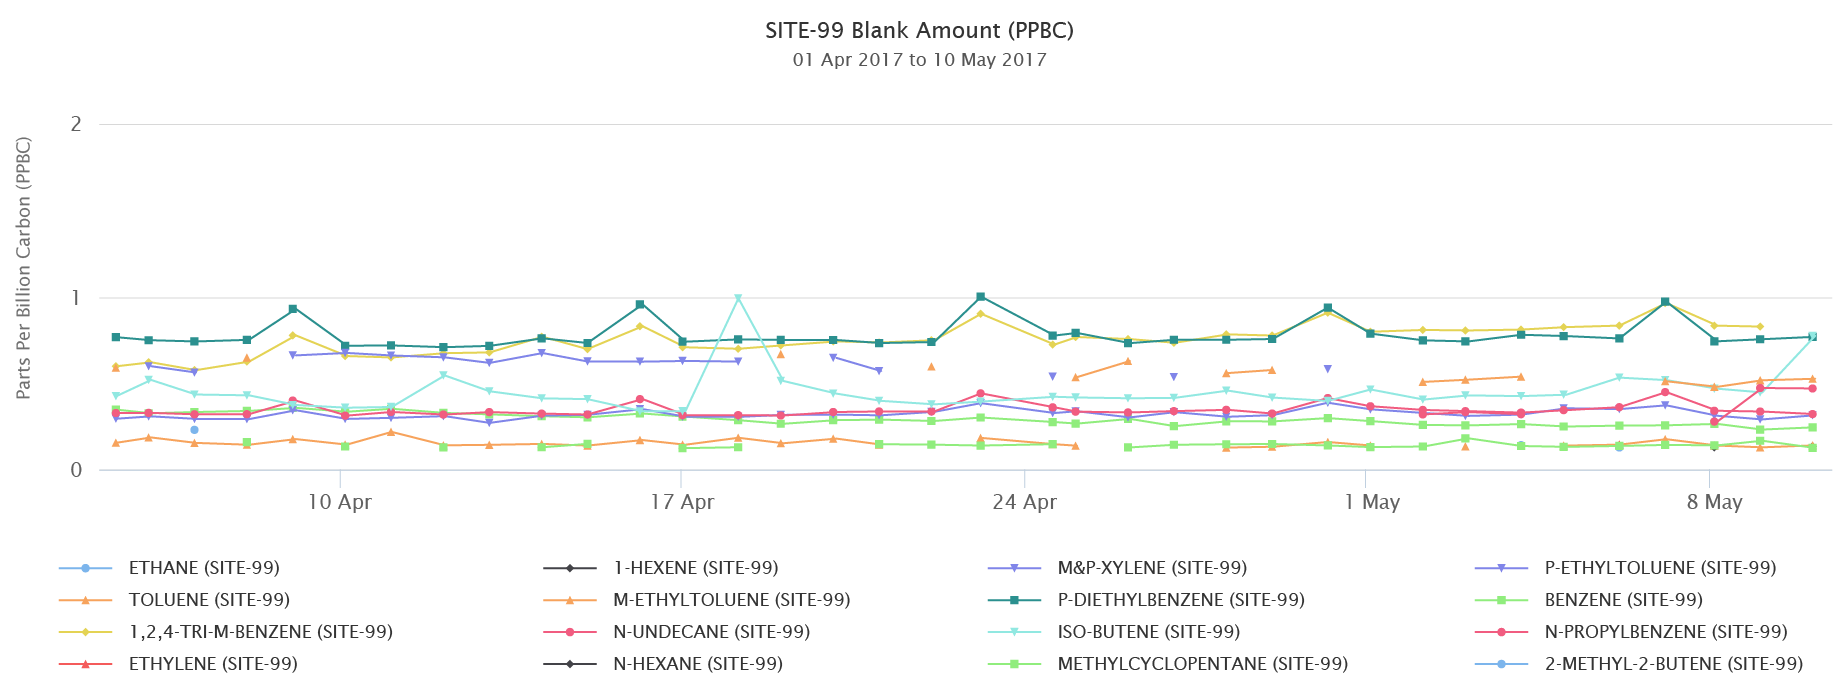
Target concentrations in daily blank from QuickLook
Retention Time Graphs
MAX allows the retention times of multiple targets to be graphed allowing validators to see targets which may be misidentified. This graph of ethyltoluenes which have very close retention times clearly shows hours where one or the other is incorrectly identified. Each data point can be highlighted and the filename of the data file and concentration shown allowing validators to quickly find the data and reprocess if possible to maintain the highest data capture. This eliminates tedious scrutiny of chromatograms.
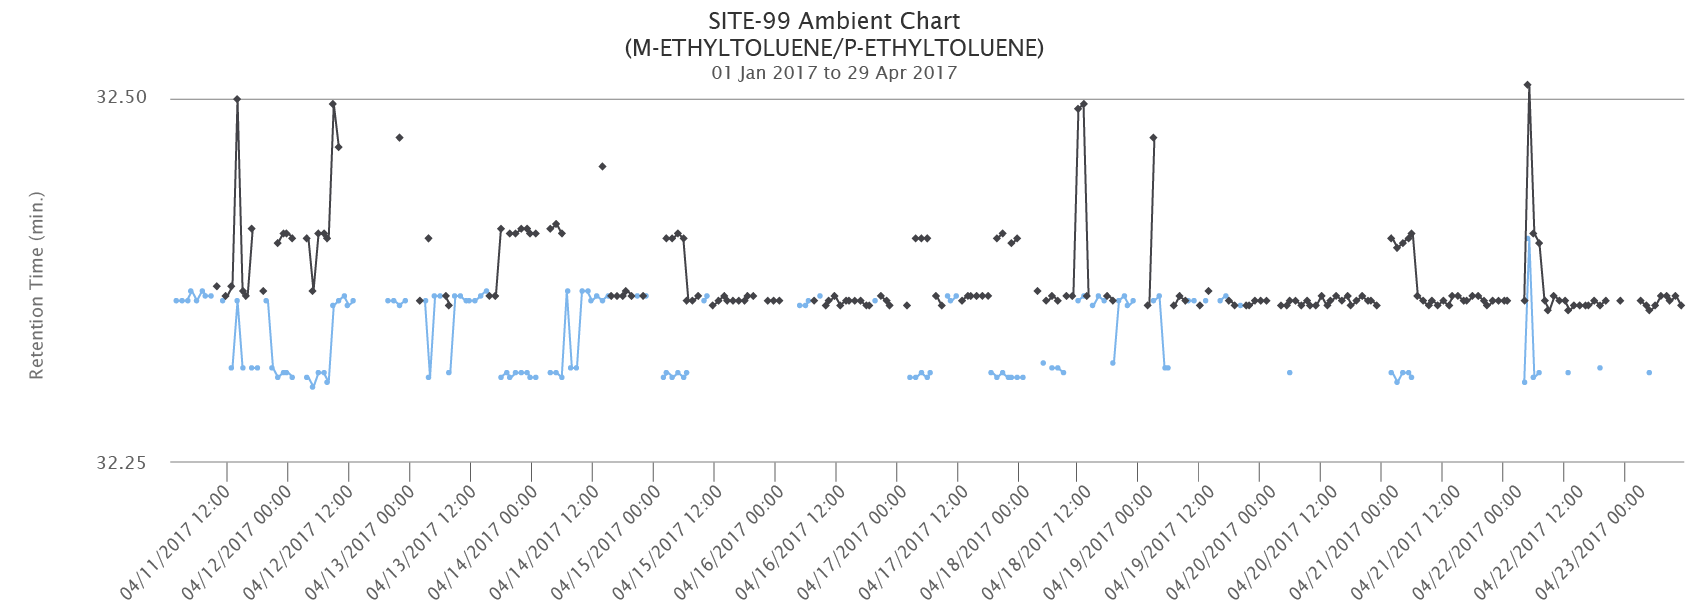
Graph of retention times for m and p ethyltoluene showing misidentification
Additional Graphic Review of Ambient Data
Ambient data can be reviewed in several different formats. Time series of multiple targets or even targets from multiple sites allows data validators the ability to review ambient data to isolate possible outliers or misidentified targets. Graphing multiple targets with known relationships or temporal patterns can highlight errors in chromatographic identification or unusual outliers. Mouse-over effects show file names to facilitate identification of chromatographic runs for review.
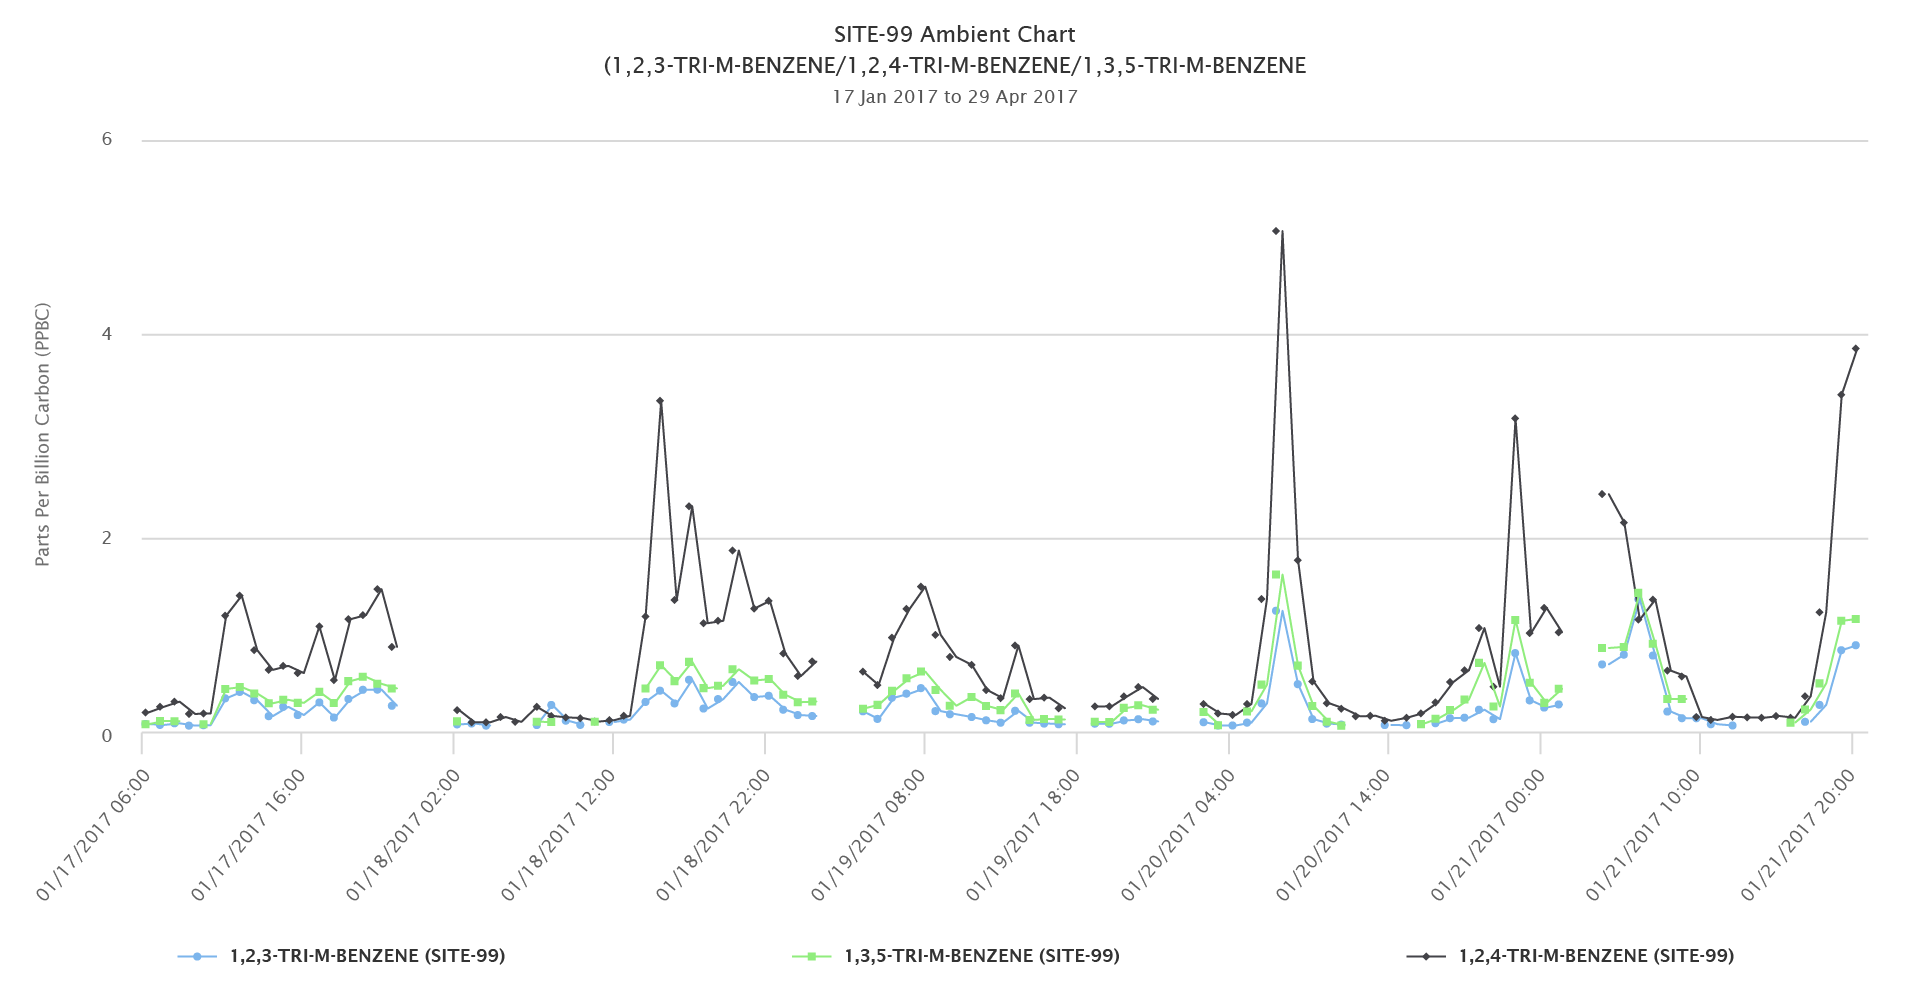
Time series of trimethylbenzenes
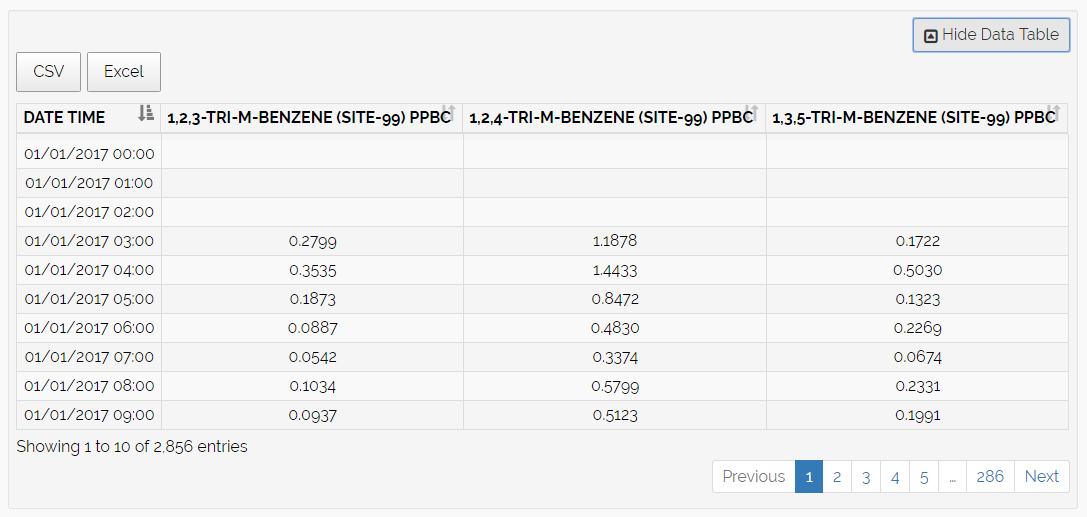
Tabular Export of Data
Graphic results can be output in the form of Excel spreadsheets or CSV files if desired. Time series, quality controls, and even scatter plot data can be output for user extraction of data. Data extraction includes the date and hour for each data point and can be reviewed before the output file is generated.